Marketing intelligence
How to Connect Snapchat Ads to BigQuery & Looker Studio: Full Guide
Build a Snapchat Ads reporting pipeline with documented attribution settings, repeatable BigQuery loads, and reconciled Looker Studio charts.
To get Snapchat Ads data into BigQuery and Looker Studio, you authorize the Snap Marketing API, pull a small daily report and load it into a staging table keyed by account, date and entity. Then you point Looker Studio at a clean BigQuery view. Write down your timezone, currency and attribution settings first, because they decide whether the dashboard ever matches Ads Manager.
Prerequisites and reporting choices
You need authorized Snapchat Ads access, the relevant ad account IDs, a Google Cloud project and a BigQuery dataset. Decide the reporting timezone, currency, date range and conversion attribution settings before extracting data.
Consult Snap's measurement documentation for supported fields and attribution windows. Don't assume every account report uses a seven-day view window. Save the settings used for each report so comparisons stay reproducible.
Extract, load and visualize
- Authorize access. Follow the Snap Marketing API guide and manage OAuth credentials and renewal securely.
- Request a small report. Select supported metrics and a completed date range. Confirm account totals before adding campaign, ad squad or ad breakdowns.
- Normalize carefully. Store IDs as strings. Record currency and convert monetary units according to the API field definition, because a raw spend value isn't necessarily in your display currency.
- Load a staging table. Validate the response, then replace or merge the reporting window using stable account, date and entity keys. Re-fetch recent periods to pick up revised conversions.
- Connect Looker Studio. Use its BigQuery connector. Build a view with explicit columns rather than assuming the sample schema below matches the API.
Suggested reporting columns
| Column group | Example columns | Check |
|---|---|---|
| Identity | Account ID, report date, ad squad ID | No duplicate rows at the chosen grain |
| Delivery | Spend in defined currency, impressions, swipes | Reconciles with Ads Manager |
| Conversion | Supported purchase counts and values | Attribution settings recorded |
| Operations | Last refresh, extraction window | Failed runs don't appear fresh |
This is an illustrative model. Calculate rates such as cost per swipe from compatible totals, and don't add up reach across days as if it counted unique people.
The same structure works for other platforms. Our TikTok to BigQuery guide uses matching keys, so the two can sit side by side in one dashboard.
Verify a dashboard before sharing it
- Compare one day's spend and delivery with Ads Manager using identical filters.
- Confirm that loading the same window again leaves totals unchanged.
- Test date and campaign filters in Looker Studio.
- Show a last-refresh timestamp on every page.
Keep Snapchat-attributed revenue separate from store revenue. Storing data in a warehouse doesn't remove duplicate conversions across platforms, and it doesn't prove incremental impact. To compare Snapchat against total revenue, use a business-level ratio like the one in how to track blended ROAS and MER.
Using AKM
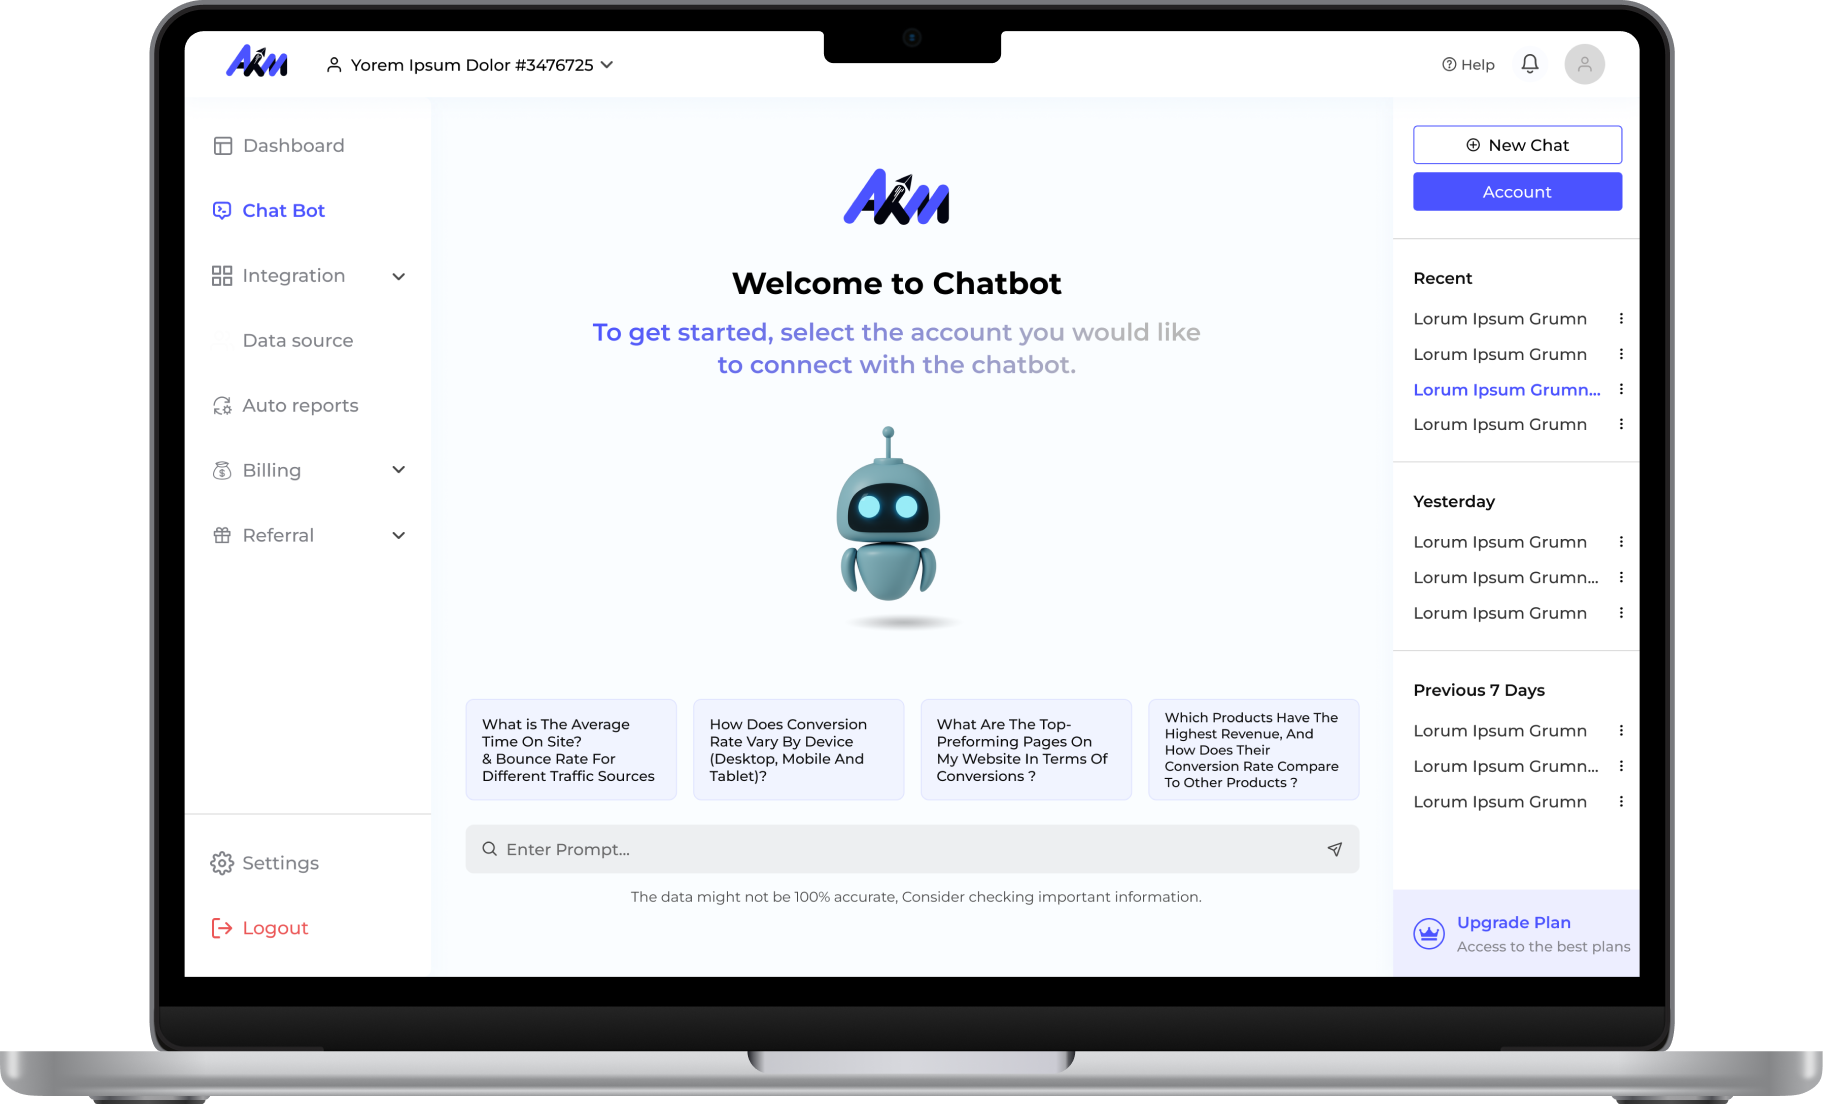
AKM connects Snapchat Ads for reporting, and its Data Hub catalog includes Snapchat Ads datasets with a BigQuery storage option. Confirm your connected account, destination configuration, available breakdowns and plan limits. A dashboard's freshness depends on successful scheduled loads, not just on a connector existing.
If you'd rather report in Looker Studio without building the warehouse step, see the Looker Studio connector page. Start with one reconciled report, then add creative and conversion views only where the fields you need are supported. See AKM integrations for all connection options.